Windsight
Data insight platform integrating regional analytics from multiple visualization sources.
DataIns
Frontend Developer
2024 - Present
1 min read
Live site: https://sandbox.windsight.id
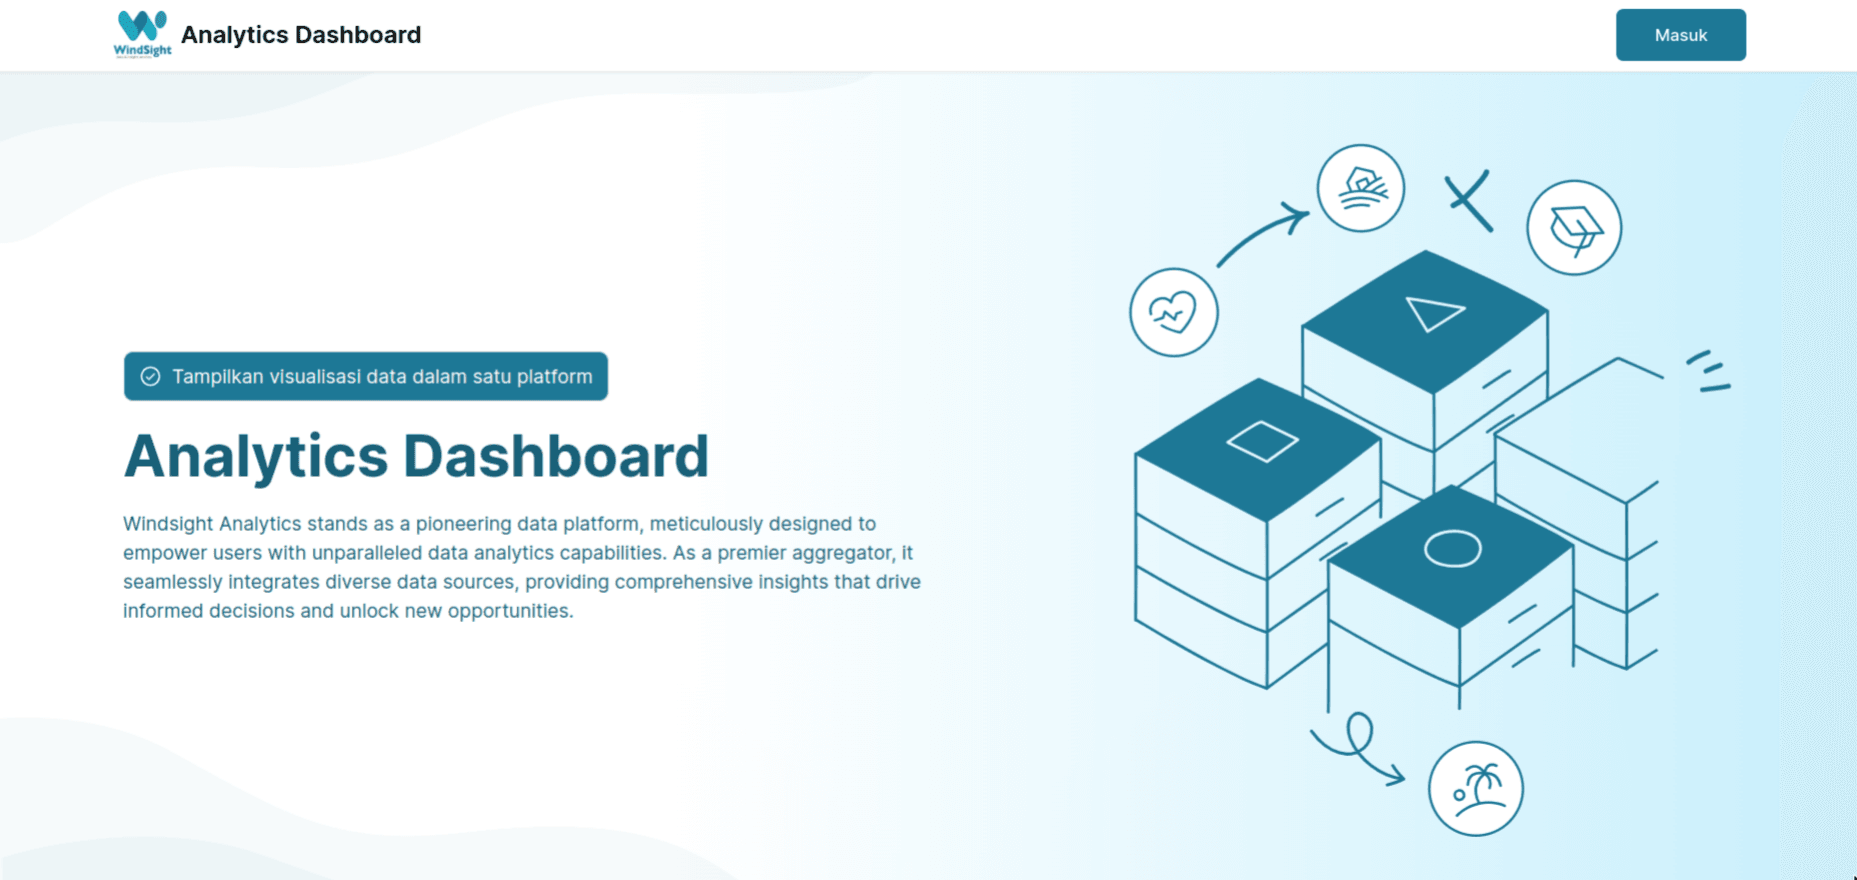
Windsight landing page
# Overview
Windsight is a data insight platform that brings together analytics from multiple visualization platforms, including Superset, Google Looker Studio, and Tableau.
# Business Context
The product is used for regional data analysis, such as city, regency, or provincial dashboards. One known use case involved public-sector data presentation for the Samarinda City Government.
# My Role
I led frontend stack direction and implementation decisions for Windsight, building from lessons learned on Robota.
# Key Capabilities
- Regional analytics presentation
- Integration with multiple dashboard providers
- Server-component-heavy data fetching approach
- Public landing surface
- Dashboard-oriented application UI
# Technical Direction
Windsight uses Next.js App Router with an emphasis on React Server Components. The goal was to move most data fetching to the server so dashboard pages remained more stable and predictable.
# Outcome / Impact
Windsight helped formalize a server-first frontend direction for analytics-heavy products and gave me a practical place to apply Next.js architecture choices to data presentation work.
# Gallery
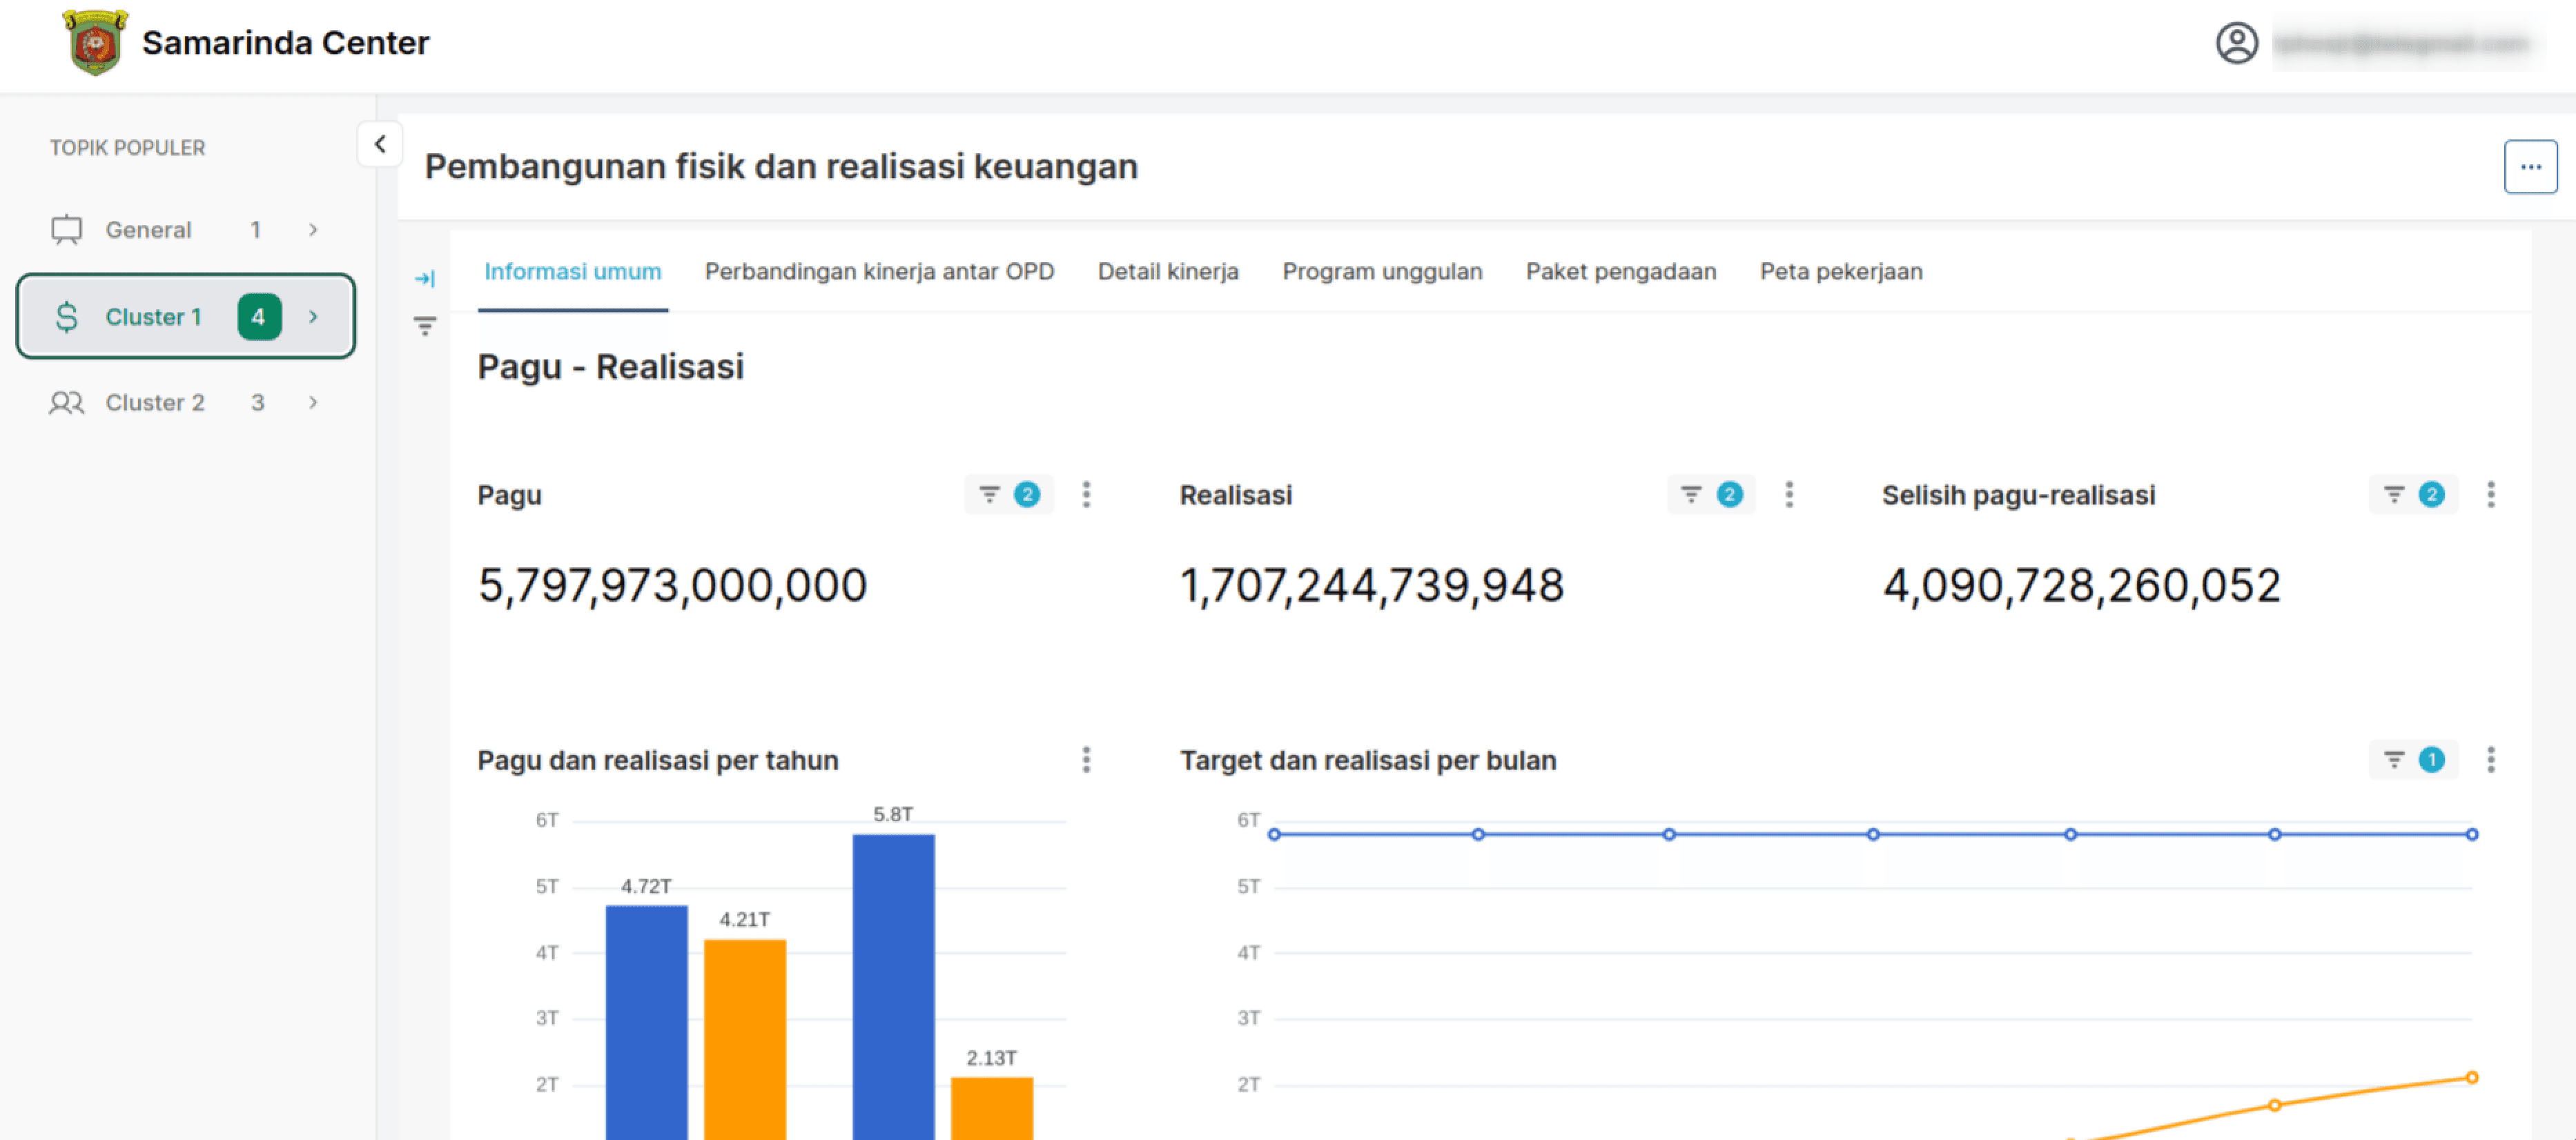
Dashboard example
- Screenshot placeholder: regional insight overview
- Screenshot placeholder: embedded analytics detail